


01 — The challenge
Client challenge
OlalaHomes managed their rental portfolio across disconnected spreadsheets and tools — with no unified view of occupancy rates, rental revenue, tenant status, or maintenance requests across their properties.
Case study · Custom software
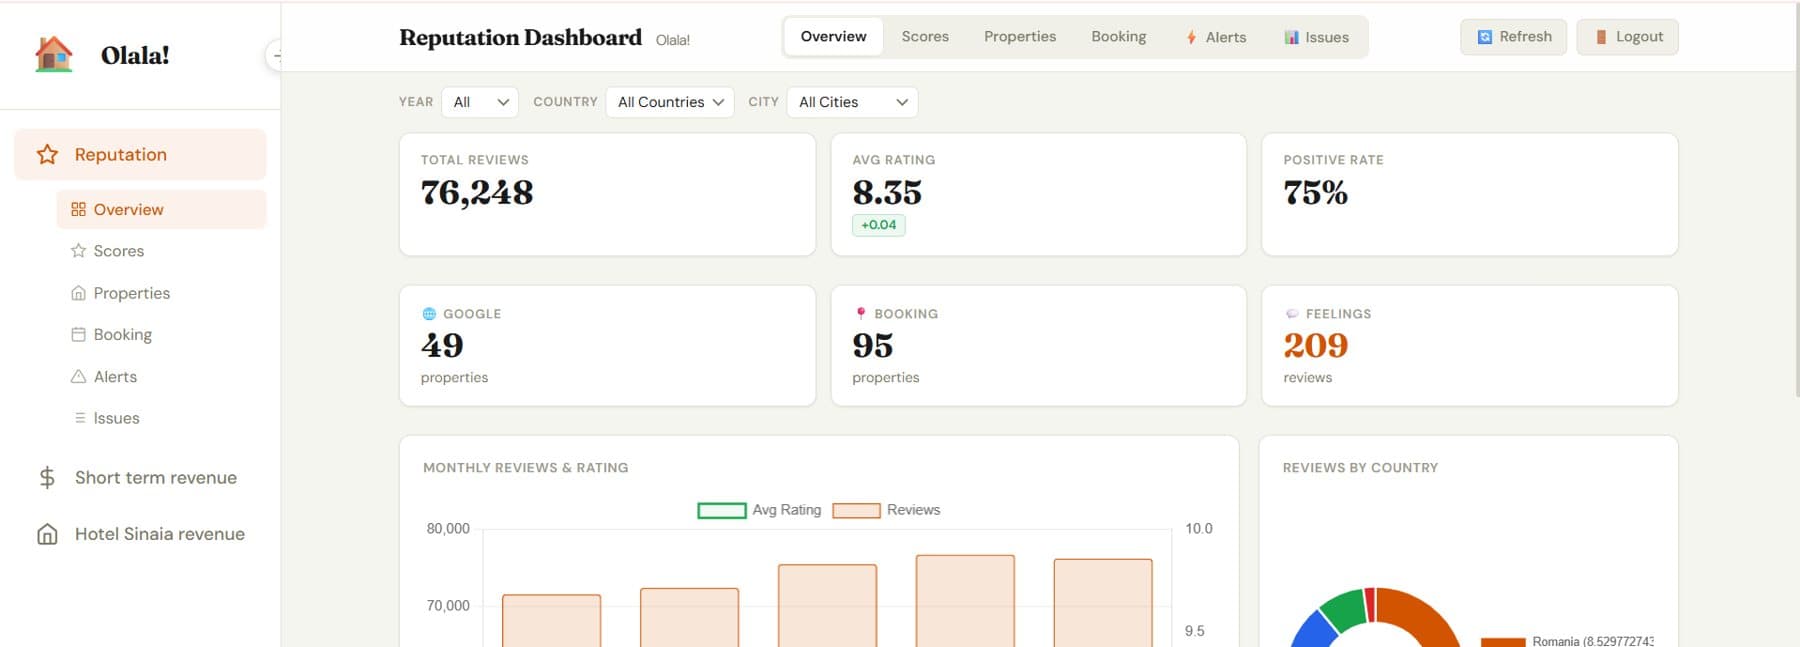
A property management dashboard for OlalaHomes that centralizes rentals, occupancy, revenue, and maintenance activity. It replaces spreadsheet reporting with one operational view for faster property decisions.
Technology stack
01 — The challenge
OlalaHomes managed their rental portfolio across disconnected spreadsheets and tools — with no unified view of occupancy rates, rental revenue, tenant status, or maintenance requests across their properties.
02 — What I built
I built a custom property management dashboard with interactive Recharts visualizations, tracking occupancy, revenue, tenant records, and maintenance requests — backed by a PostgreSQL database and Next.js frontend.
03 — The outcome
15+ hours per week saved on manual reporting. OlalaHomes now has a single source of truth for their entire portfolio — with the metrics and operational visibility needed to make faster, more informed property decisions.
Next project
SaaS · Next.js · Web3 · OpenAI
Read the case study